Ladybug

Ladybug performs detailed analysis of climate data to produce customized, interactive visualizations for environmentally-informed design.

What is Ladybug?


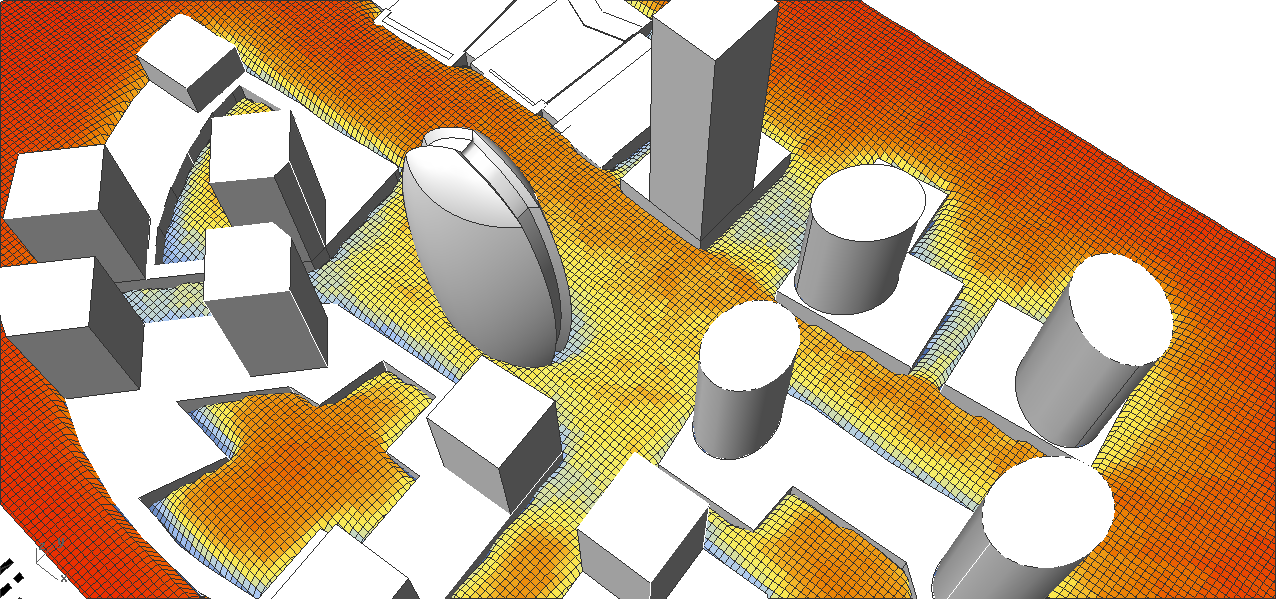
Ladybug imports standard EnergyPlus Weather files (.EPW) into Grasshopper. It provides a variety of 2D and 3D interactive climate graphics that support decision-making during the early stages of design. Ladybug also supports the evaluation of initial design options through solar radiation studies, view analyses, sunlight-hours modeling, and more. Integration with visual programming environments allows instantaneous feedback on design modifications and a high degree of customization.


Climate Data Plots
Sunpath Graphics
Shadow Studies
View from Sun
Solar Access Studies
Solar Envelope
Radiation Studies
View Studies
Psychrometric Charts
Adaptive Comfort Charts
Outdoor Comfort Studies
Shadow Masks

Climate Data Plots

Interpret data through a variety of 2d and 3d charts.

Check for examples
  •  
  • Sunpath Graphics

    Produce meaningful solar diagrams.

    Check for examples
  •  
  • Shadow Studies

    Understand where the sun is shining.

    Check for examples
  •  
  • View From Sun

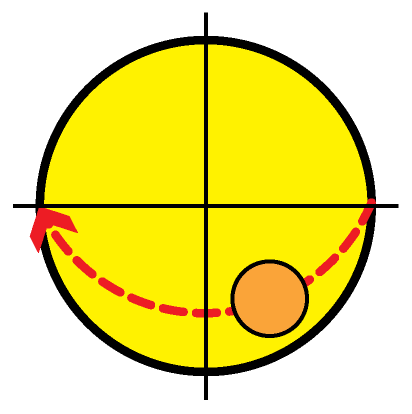
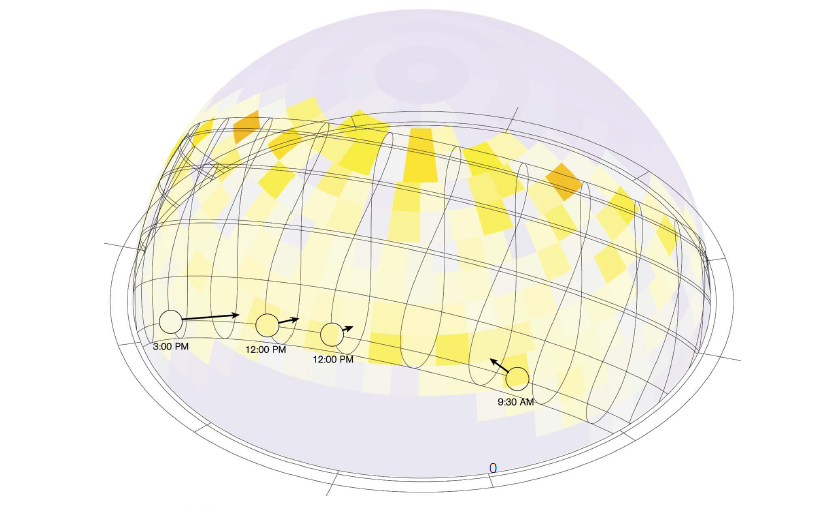
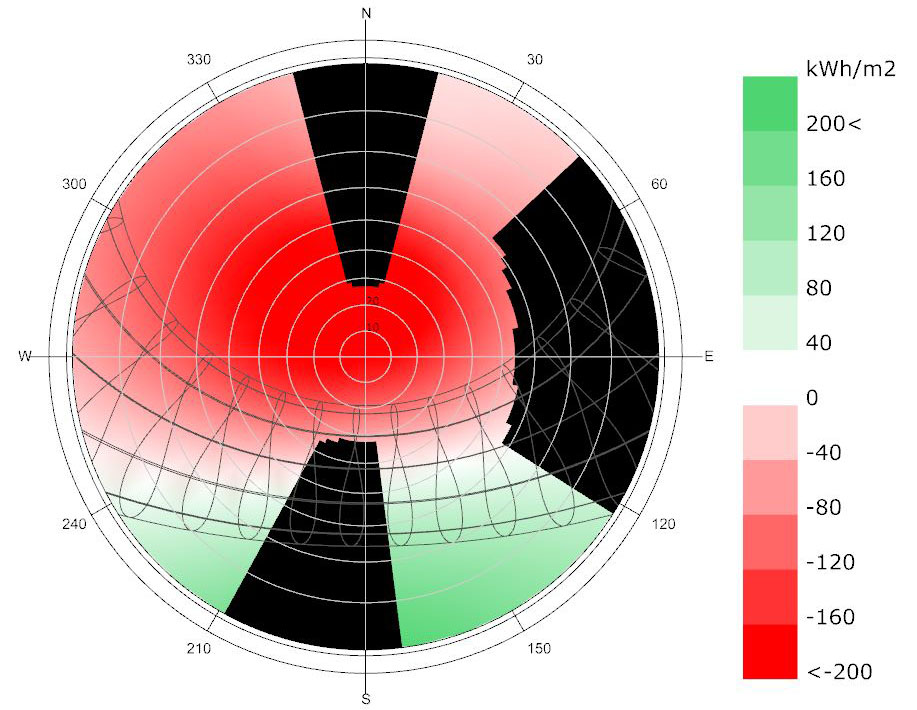
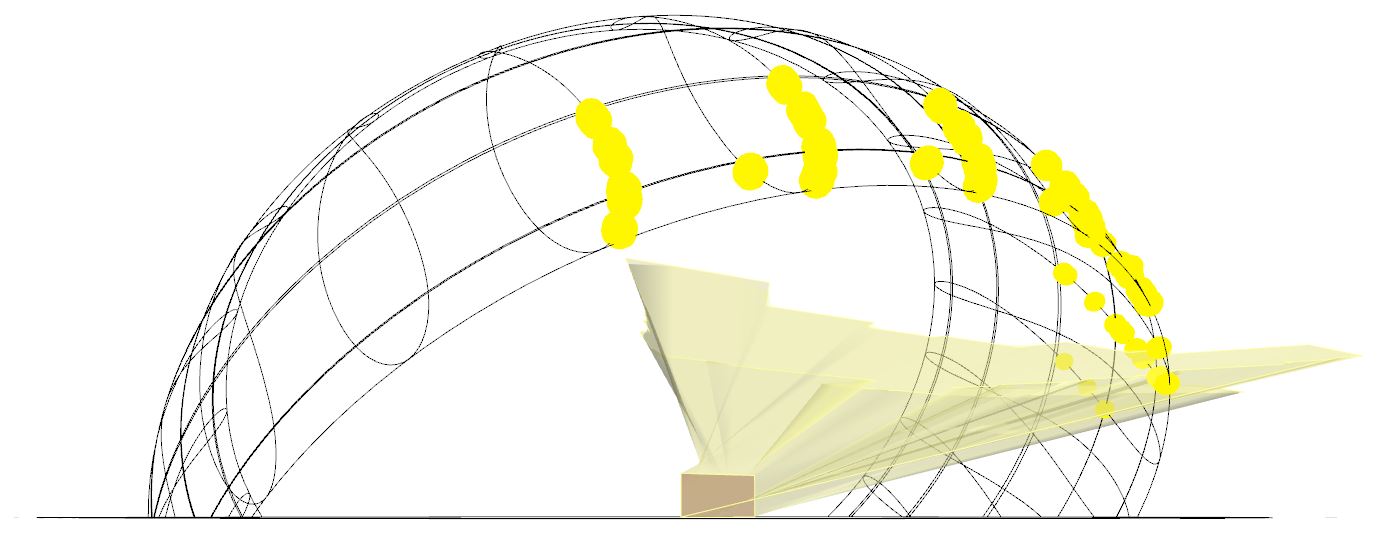
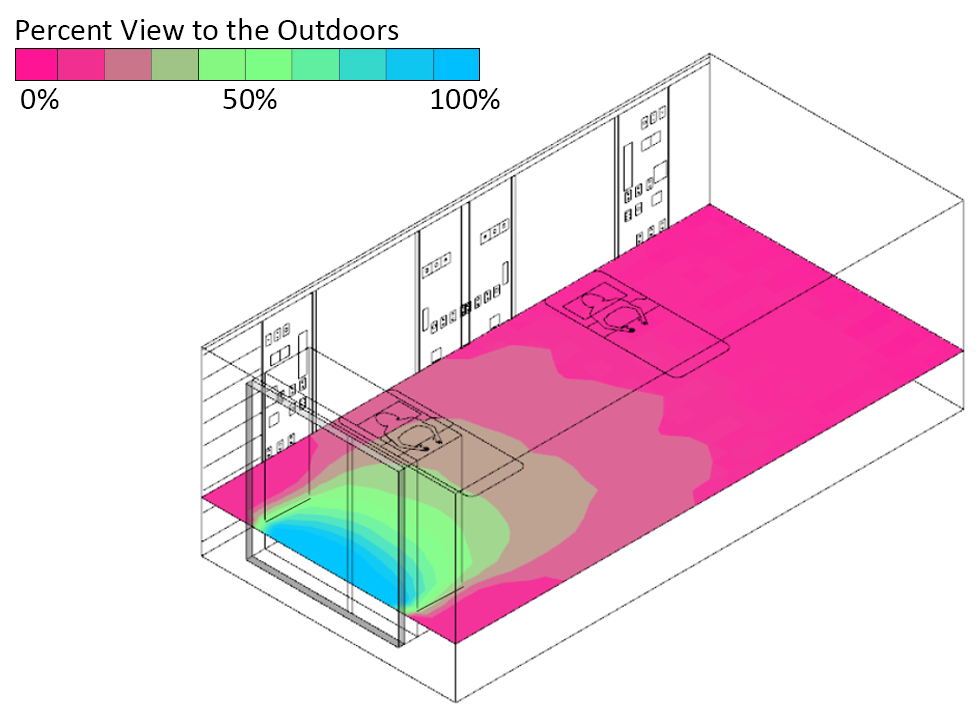
    Make realtime animations of what sees the sun at different times of the day.

    Check for examples
  •  
  • Solar Access Studies

    See where and when the sun shines.

    Check for examples
  •  
  • Solar Fan and Envelope

    Find buildable volumes to maintain solar access.

    Check for examples
  •  
  • Radiation Studies

    Quickly quantify solar energy falling on your geometry.

    Check for examples
  •  
  • View Studies

    Measure the visual connection to the outdoors.

    Check for examples
  •  
  • Psychrometric Charts

    Customize your familiar thermal comfort graphics.

    Check for examples
  •  
  • Adaptive Comfort Charts

    Evaluate the thermal comfort of your passive designs.

    Check for examples
  •  
  • Outdoor Thermal Comfort

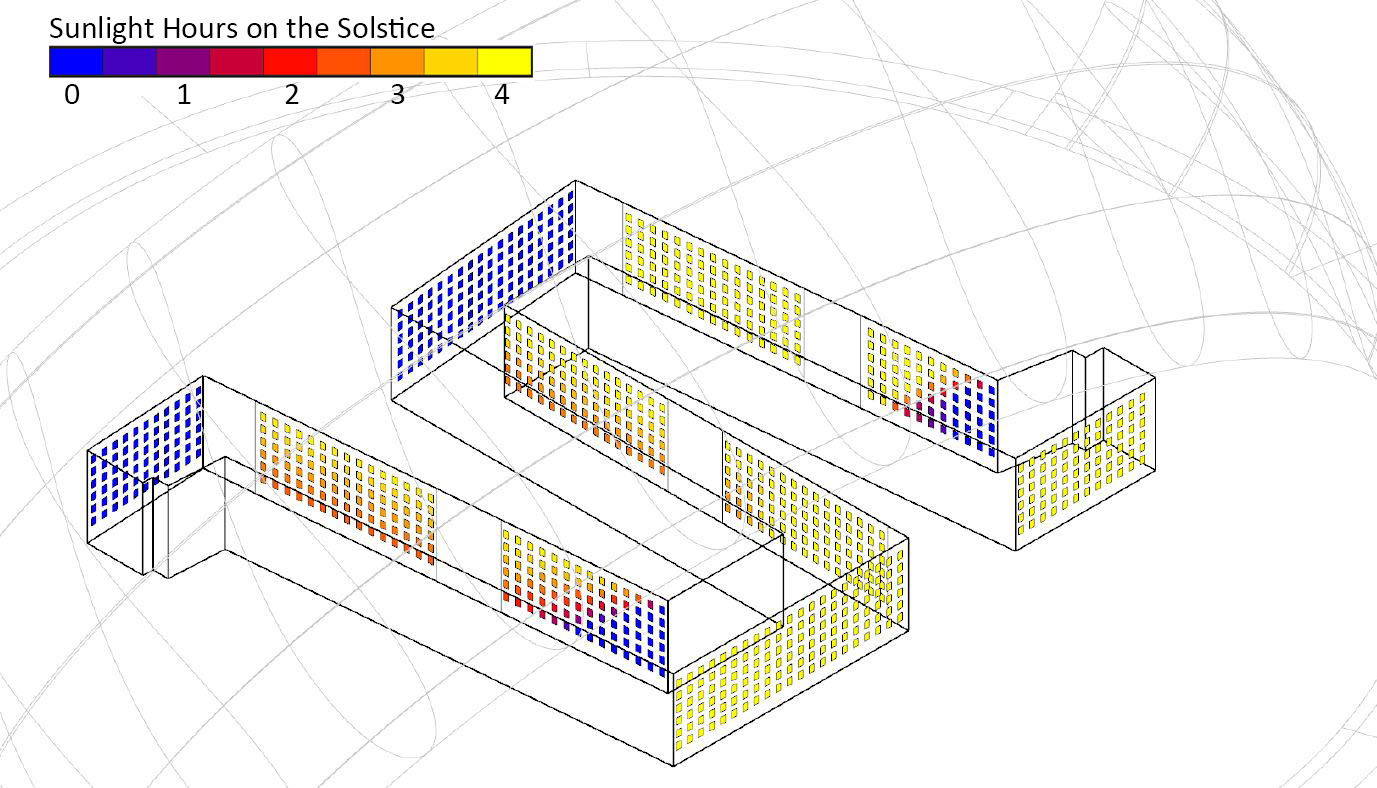
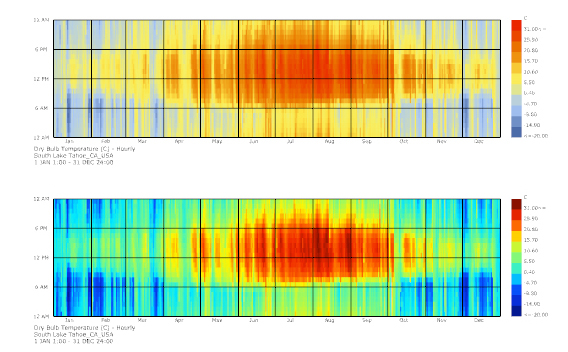
    Account for sky heat exchange and use the latest outdoor comfort models.

    Check for examples
  •  
  • Local Thermal Comfort

    Model radiant asymmetry, downdraft discomfort, and more.

    Check for examples
  •  
  • Shade Benefit Analysis

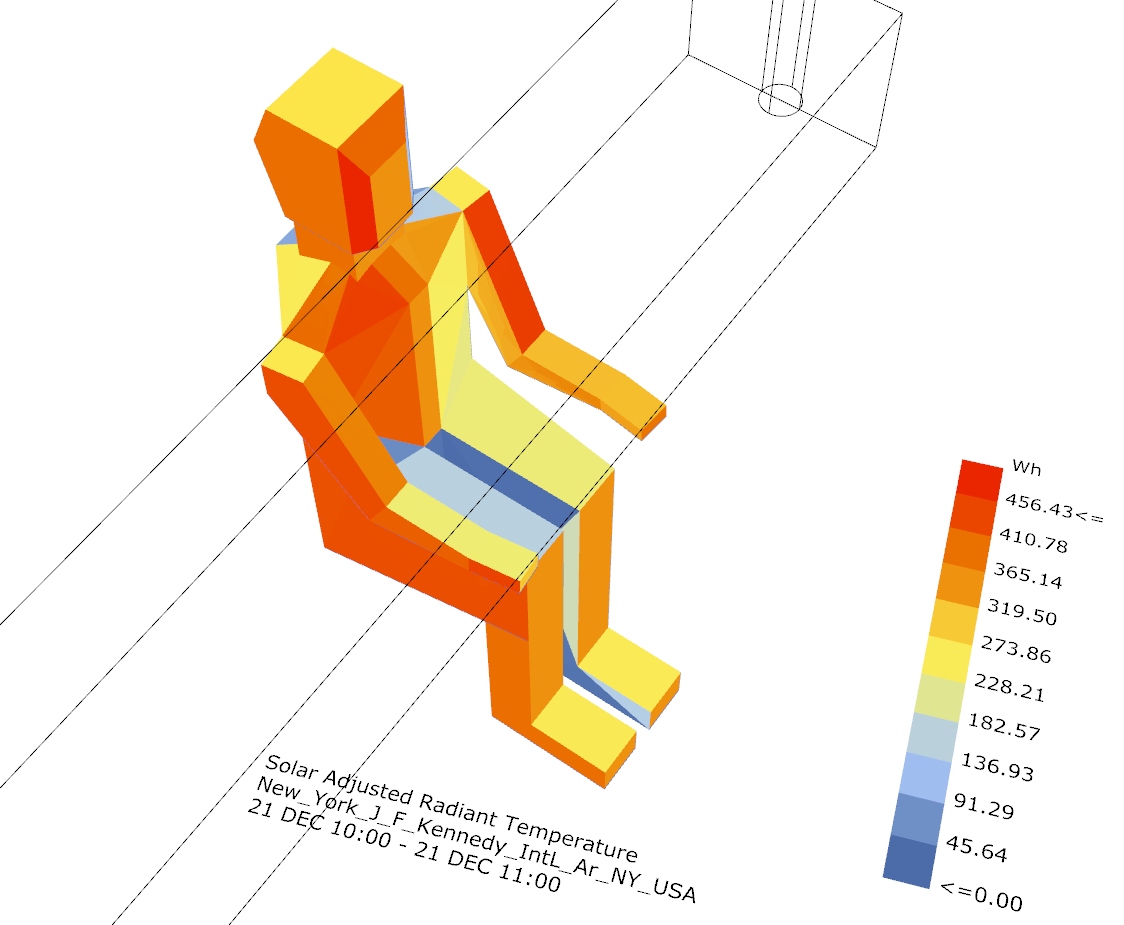
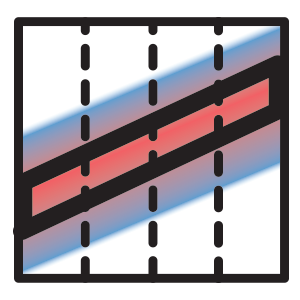
    Visualize the regions of a shade that are most are helpful and harmful to thermal comfort.

    Check for examples
  •  
  • Shadow Masks

    See the portions of sky blocked by shades and context

    Check for examples
  •